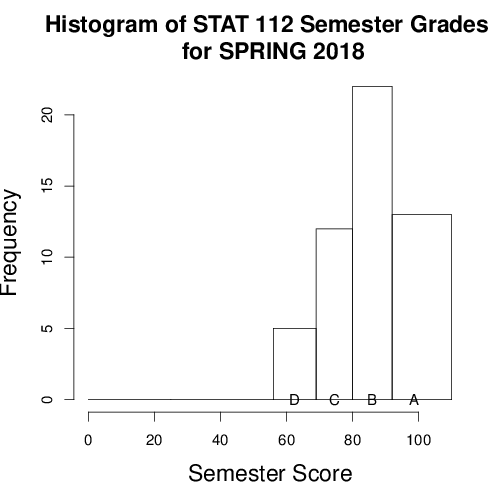
The histogram of the semester scores shows a distribution which favors the high end of the grading scale.
- Full Screen of the Histogram of Semester Scores
A noteworthy relationship can be observed in the plot of the Semester Scores and the average Quiz score. The plot shows that a linear relationship exits between Semester Scores and the average Quiz score. We learned in STAT2112 that by means of the method of least squares, it is possible to test the hypothesis that the slope equals zero versus the alternative that it does not equal zero. The F statistic, as you might imagine, is very large. In other words, there is evidently an inherent relation between doing the quizzes well and getting a good semester grade.
- Full Screen of the Relation between Semester Scores and Quiz Average
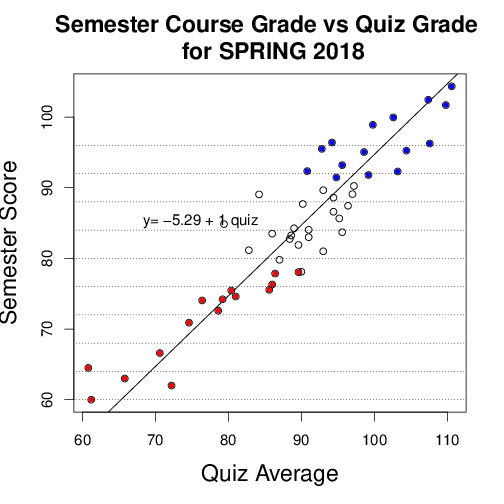
Included in the plot of semester scores vs quiz average is the classroom attendance. Though I do not take roll call, I do make an informal record of attendance. Those blue points on the plot correspond to the ranking of the top fifteen students. The top ten students missed a total of 9 classes, whereas the bottom 10 students marked by red points missed 28 classes. There appears to be a strong correlation between attendance and semester grades. Notwithstanding the existence of confounding factors like enthusiasm, the high positive correlation between grades and attendance reflects my efforts to design assignments which favor those students who attend class as I forwarned in my first lecture. Another useful correlation is the one between quiz scores and everything else like computer assignments and exam scores.
- Full Screen of Histogram of Final Exam Scores
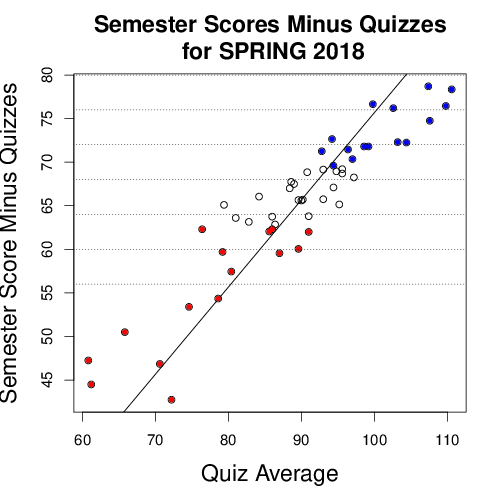
A noteworthy feature of this plot is the strong linear relation between quiz scores and other assignments. From an instructor's perspective, the linear relation indicates consistency between quizzes, computer assignments, and examination; they are integrated with one another.